A small online business can generate an enormous amount of data.
Your website may report:
- Page views.
- Sessions.
- Search impressions.
- Search clicks.
- Engagement.
- Referrals.
Your email platform may report:
- New subscribers.
- Open rates.
- Clicks.
- Unsubscribes.
- Automation activity.
Your checkout system may report:
- Sales.
- Revenue.
- Refunds.
- Conversion rates.
Your content calendar may contain another dozen numbers.
The problem is not lack of information.
The problem is deciding which numbers actually help you run the business.
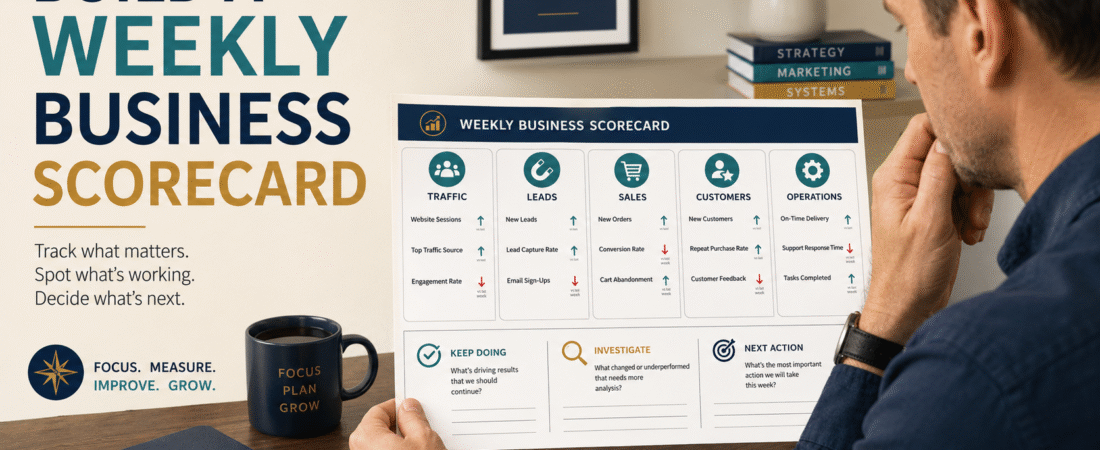
A simple weekly business scorecard solves that problem by reducing dozens of possible metrics to a small group that answers five practical questions:
- Are people finding the business?
- Are some of them becoming leads?
- Are some leads or visitors becoming customers?
- Are customers experiencing problems?
- Is the operating system working?
The U.S. Small Business Administration recommends defining measurable marketing and sales goals, tracking costs, and consistently measuring effectiveness rather than relying on impressions or assumptions.
For a solo or small online business, you do not need a complicated executive dashboard.
One page is enough.
What a Weekly Business Scorecard Is
A scorecard is not the same as an analytics report.
An analytics report tells you what happened.
A scorecard should help you decide what deserves attention.
For example:
Website visitors increased 12%.
Interesting.
But what decision follows?
If:
- Visitors rose.
- Leads remained unchanged.
- Sales remained unchanged.
then the useful question may be:
Why is additional traffic not moving people to the next step?
The scorecard converts measurement into management.
Start With Five Business Areas
A practical online-business scorecard can be divided into:
1. Traffic
Are people finding you?
2. Leads
Are people joining your audience?
3. Sales
Are people buying?
4. Customers
Are buyers receiving a good experience?
5. Operations
Is the business system functioning reliably?
These five areas create a basic path from discovery to delivery.
Section 1: Traffic
Choose only a few useful traffic signals.
Possible metrics:
- Google Search clicks.
- Website sessions.
- Top traffic source.
- Top landing page.
You do not need all of them.
For a content-driven site, two might be enough:
Google Search Clicks This Week
Total Website Sessions This Week
Then record the previous week beside them.
Example:
| Metric | This Week | Last Week | Direction |
|---|---|---|---|
| Search Clicks | 420 | 398 | Up |
| Website Sessions | 610 | 575 | Up |
The purpose is not celebrating every increase.
It is noticing a meaningful pattern.
Section 2: Leads
If email is part of the business, measure audience growth.
Useful metrics may include:
- New email subscribers.
- Lead-magnet conversions.
- Unsubscribes.
For a simple business:
New Subscribers: 24
Unsubscribes: 3
That tells you much more than staring at your total subscriber count.
A large total list can hide the fact that almost nobody new is joining.
If you are still building the underlying list-building system, How to Build an Email List With One Lead Magnet and a Simple Welcome Series provides the foundation.
Section 3: Sales
Do not make this unnecessarily complicated.
For many small digital-product businesses, track:
- Number of sales.
- Gross sales revenue.
- Refunds.
Perhaps:
| Metric | This Week | Last Week |
|---|---|---|
| Orders | 7 | 5 |
| Gross Sales | $240 | $185 |
| Refunds | 0 | 1 |
You may eventually track more sophisticated numbers.
But first determine whether customers are actually purchasing.
Do Not Confuse Revenue With Profit
Revenue is money collected from sales.
It is not automatically profit.
Software subscriptions, payment fees, advertising, refunds, affiliate commissions, taxes, and other costs may affect what remains.
For a simple weekly scorecard, gross revenue may still be useful as long as you label it correctly.
Do not create a false sense of precision.
Section 4: Customer Experience
A small creator can learn a surprising amount from customer problems.
Track:
- Support requests.
- Access failures.
- Refund requests.
- Repeated questions.
Example:
Support requests: 5
Access issues: 2
Repeated question: “Where do I download the workbook?”
That repeated question may deserve more attention than a 3% change in website traffic.
The purpose of the business is not merely getting people through checkout.
It is helping customers successfully receive and use what they purchased.
Section 5: Operations
This is the section many dashboards ignore.
Ask:
Did the business machinery work?
Track exceptions rather than everything.
Examples:
- Broken links found.
- Failed automations.
- Website downtime.
- Missing product files.
- Software problem.
- Publishing failure.
If everything worked:
Operational Exceptions: 0
That is enough.
Your existing guide to using AI to separate important work from online-business busywork is useful here because a scorecard should emphasize work tied to actual business outcomes rather than activity for activity’s sake.
Do Not Track a Metric Merely Because Software Displays It
Software companies love dashboards.
Every dashboard contains more metrics because more metrics make the product appear powerful.
You do not need to use them all.
Ask:
If this number changes, will I make a different decision?
If no, it probably does not belong on the weekly scorecard.
Separate Leading and Lagging Indicators
A useful distinction is:
Leading Indicators
Activities or signals that occur before a result.
Examples:
- New subscribers.
- Product-page visits.
- Email clicks.
Lagging Indicators
Results that appear afterward.
Examples:
- Sales.
- Revenue.
- Refunds.
You may have a healthy leading indicator even before sales respond.
For example:
New subscribers may increase for several weeks before enough people move through the welcome sequence to buy.
Include Trends, Not Just Numbers
A number without comparison tells you little.
14 sales
Is that good?
You need context.
Compare with:
- Last week.
- Four-week average.
- Monthly target.
But avoid comparing random periods.
Weekly scorecards work best when the period remains consistent.
Add a Four-Week View
A single week can be unusual.
Add four recent values.
Example:
| Week | New Leads |
|---|---|
| Week 1 | 18 |
| Week 2 | 20 |
| Week 3 | 22 |
| Week 4 | 25 |
Now you can see a direction.
Do not overreact to one unusually good or bad week.
Include Only One Decision Column
This is the most important part.
Add:
Action
Possible entries:
- Keep monitoring.
- Investigate.
- Fix.
- Test.
- No action.
Example:
| Metric | Result | Action |
|---|---|---|
| Search traffic | Up | No action |
| Leads | Flat | Check signup page |
| Sales | Up | Keep current offer |
| Support | 4 access issues | Improve onboarding |
| Broken links | 2 | Fix immediately |
Now the scorecard is useful.
Use Red, Yellow, and Green Carefully
You can use simple status labels:
Green — Within normal range
Yellow — Investigate
Red — Requires action
But define what the colors mean.
Do not mark sales “red” simply because they declined one week.
A real red condition might be:
- Checkout broken.
- Delivery failed.
- Website unavailable.
- Refund spike.
- Email automation stopped.
Do Not Create Fake Targets
If you have no history, do not invent an arbitrary target.
For your first month, collect a baseline.
Then ask:
- What is normal?
- What is improving?
- What repeatedly underperforms?
Real baselines are better than motivational numbers.
A Simple One-Page Scorecard
Your scorecard might contain:
TRAFFIC
Search Clicks:
Website Sessions:
LEADS
New Subscribers:
Unsubscribes:
SALES
Orders:
Gross Sales:
Refunds:
CUSTOMERS
Support Requests:
Repeated Problem:
OPERATIONS
Publishing Problems:
Broken Links:
Automation Failures:
THIS WEEK’S DECISION
Keep Doing:
Investigate:
Fix:
That is enough.
Review the Scorecard at the Same Time Each Week
Consistency improves interpretation.
For example:
Monday morning: review previous Monday through Sunday.
Avoid reviewing:
- Monday–Thursday one week.
- Friday–Wednesday the next.
- Ten days the next.
Stable periods create clearer trends.
Do Not Spend More Time Reporting Than Managing
A common mistake is building an elaborate spreadsheet that takes two hours to update.
For a small business, the scorecard should ideally be simple enough that most numbers can be collected quickly.
If a metric requires 30 minutes of manual work and does not affect a decision, remove it.
Use AI to Interpret—Not Invent—The Numbers
AI can help you review a scorecard.
For example:
Here are my last four weeks of traffic, leads, sales, refunds, support requests, and operational problems. Identify meaningful changes, possible questions to investigate, and areas where I should avoid drawing a conclusion from too little data.
That can be useful.
Do not ask:
Make up realistic numbers for my business and tell me whether I’m succeeding.
The scorecard must use real measurements.
Keep a Decision Journal
Suppose your scorecard shows lead growth declining.
You decide:
Improve the lead-magnet signup page before creating another lead magnet.
Record that.
A few weeks later, you can evaluate whether the decision helped.
Your guide to keeping an AI decision journal for better business choices provides a natural companion system.
What Not to Put on the Scorecard
Avoid filling it with:
- Every social follower count.
- Every keyword position.
- Every email open rate.
- Every page view.
- Every affiliate click.
- Every software statistic.
Some may be useful during a specific investigation.
They do not all need to live on the weekly control panel.
A 15-Minute Weekly Review
Ask:
Traffic
Did discovery materially change?
Leads
Are people joining the audience?
Sales
Did purchasing behavior change?
Customers
Is there a repeated problem?
Operations
Did anything break?
Then answer:
What is the one thing I should keep doing?
What is the one thing I should investigate?
What is the one thing I should fix?
Stop there.
Conclusion
A weekly business scorecard should simplify your business, not create another reporting job.
Track only the numbers that help you understand traffic, leads, sales, customers, and operations.
Compare them consistently.
Look for trends.
Then convert the information into one or two decisions.
Your scorecard does not need to impress anyone.
It needs to answer one practical question:
What deserves my attention this week?